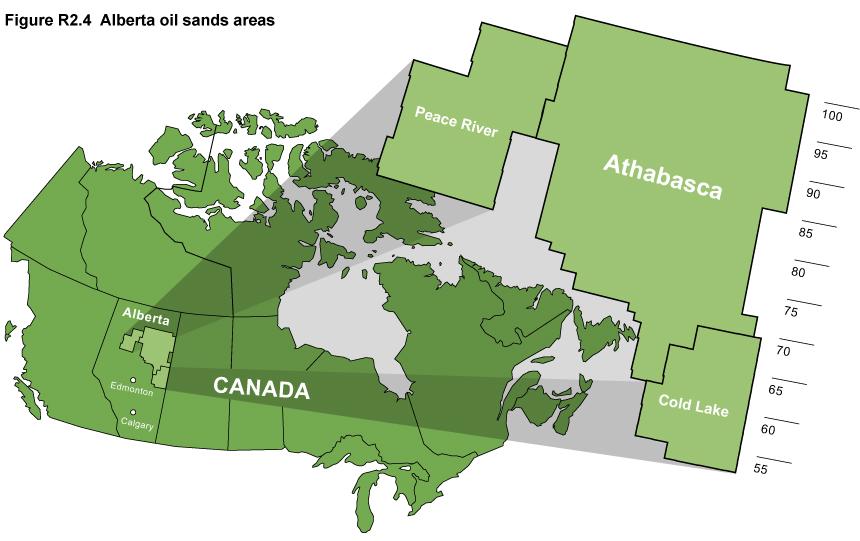
The AER has limited its geological evaluation of bitumen resources to the Wabiskaw Member and McMurray Formation within the Athabasca oil sands area (Figure R2.4). Estimated reserves include only those portions of the resource that are technically recoverable using steam-assisted gravity drainage (SAGD) from the McMurray Formation. These estimates do not consider the economics of any project. The assessment includes data as of August 1, 2019.
The current estimating methodology involves applying appropriate cutoffs to reservoir properties to exclude nonreservoir intervals in the net pay thickness. Reserve estimates are derived volumetrically using stochastic methods to capture the uncertainty of cutoffs used to determine net pay and to estimate bitumen reserves and resources.
Historically, the AER estimated reserves for the Wabiskaw-McMurray units combined. The approach used a volumetric calculation that did not discriminate between the nonreservoir and reservoir intervals.
Figure R2.7 shows the difference in net pay between the historical and current methods. The historical reserves estimate for the Wabiskaw-McMurray used a 1.5 m continuous net pay thickness cutoff. The current reserves estimate for the McMurray SAGD potential uses a 7 m continuous net pay thickness cutoff, considering 5 m between the injector well and producer well.
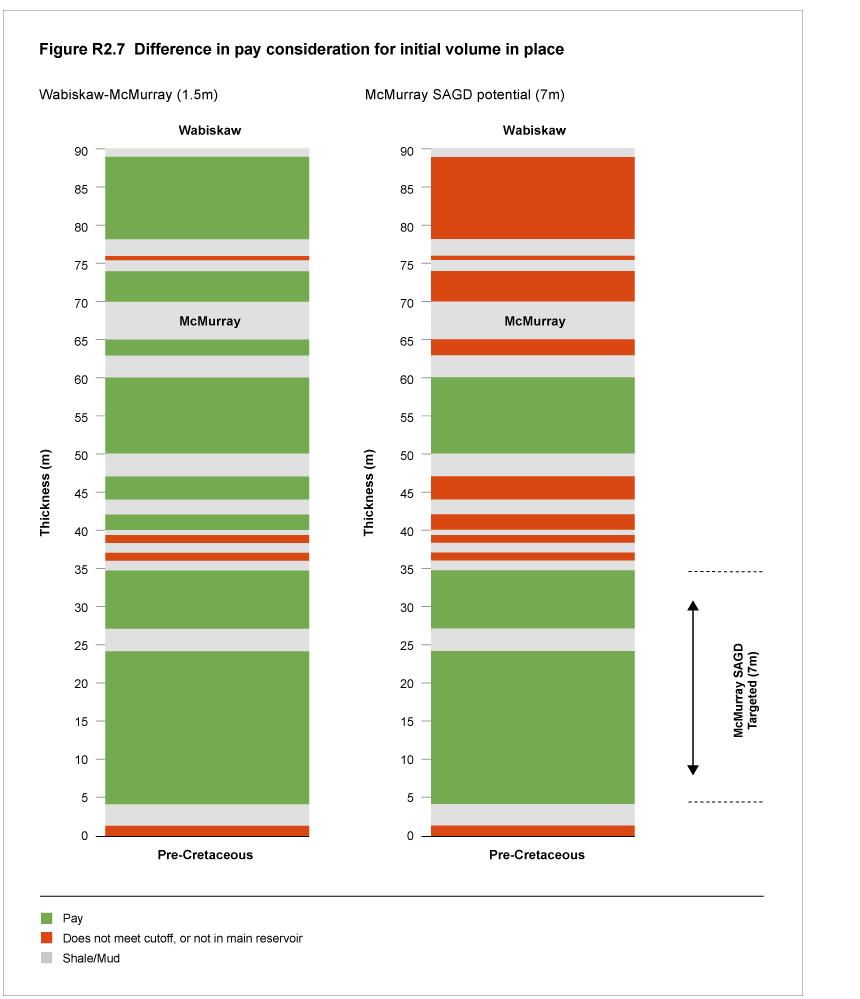
The stochastic method uses variable cutoffs for the mass bitumen fraction to capture the uncertainty in reservoir thickness. Net pay probability was calculated for the Wabiskaw-McMurray, McMurray SAGD potential, and McMurray SAGD targeted. Also, each SAGD project was assessed separately because the rock quality varies between projects. The mass bitumen fraction cutoffs varied between 6.5% and 10%, resulting in low, medium, and high estimates of net pay probability at each location.
Cases are compared with operator-submitted values and a base case net pay probability is used to quantify the associated low, medium, and high estimates for porosity, oil saturation, and net pay over the reservoir interval. These are used as input values to define the distribution shape (range/standard deviation and frequency), which constrains random values for each data type during the simulation.
Randomly simulated net pay, effective porosity, and oil saturation values are used to output simulated oil column results.
Stochastic original bitumen in place (OBIP) is calculated by modelling simulated oil column results from each well to account for reservoir heterogeneities, assess areal uncertainty, and report the OBIP by ranges as low, medium, and high estimates.
Figures R2.8 and R2.9 show the regional net pay maps for the Wabsikaw-McMurray oil sands deposit and the McMurray oil sands deposit with a 7 m continuous cutoff.
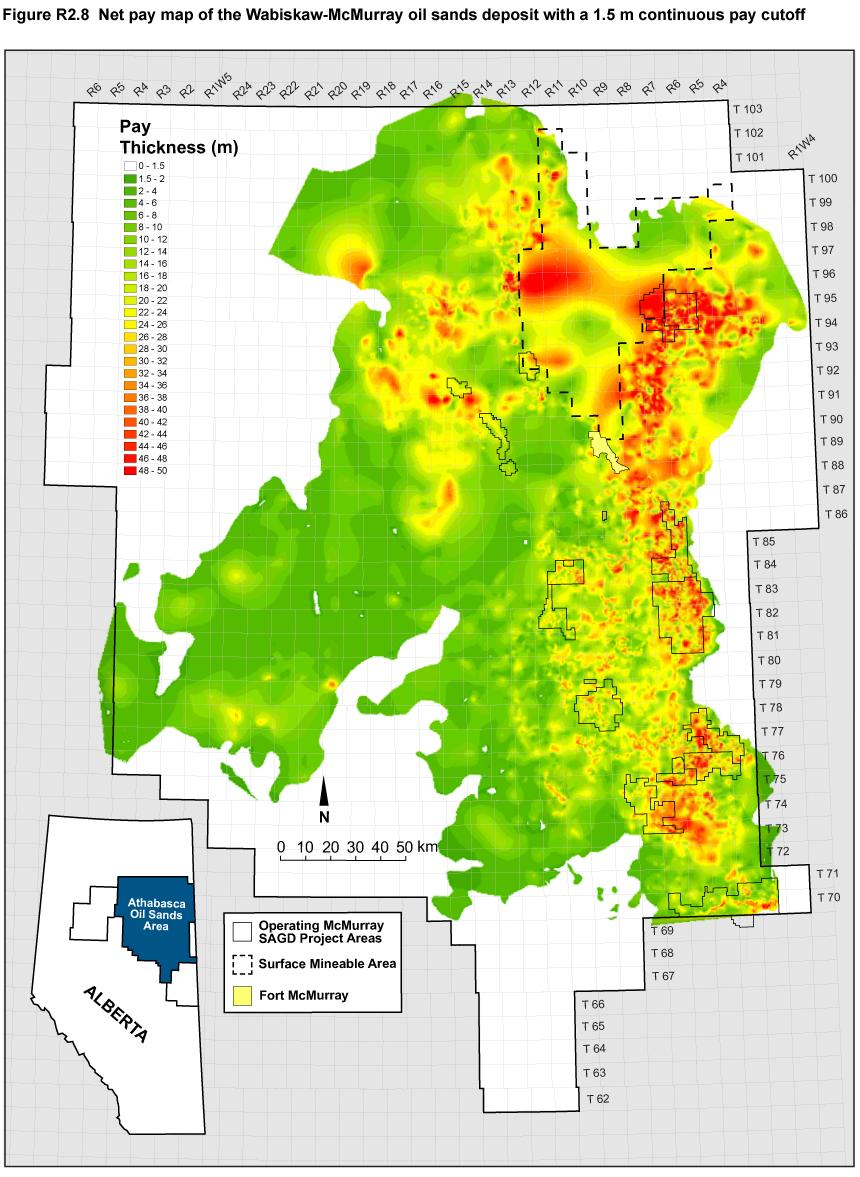
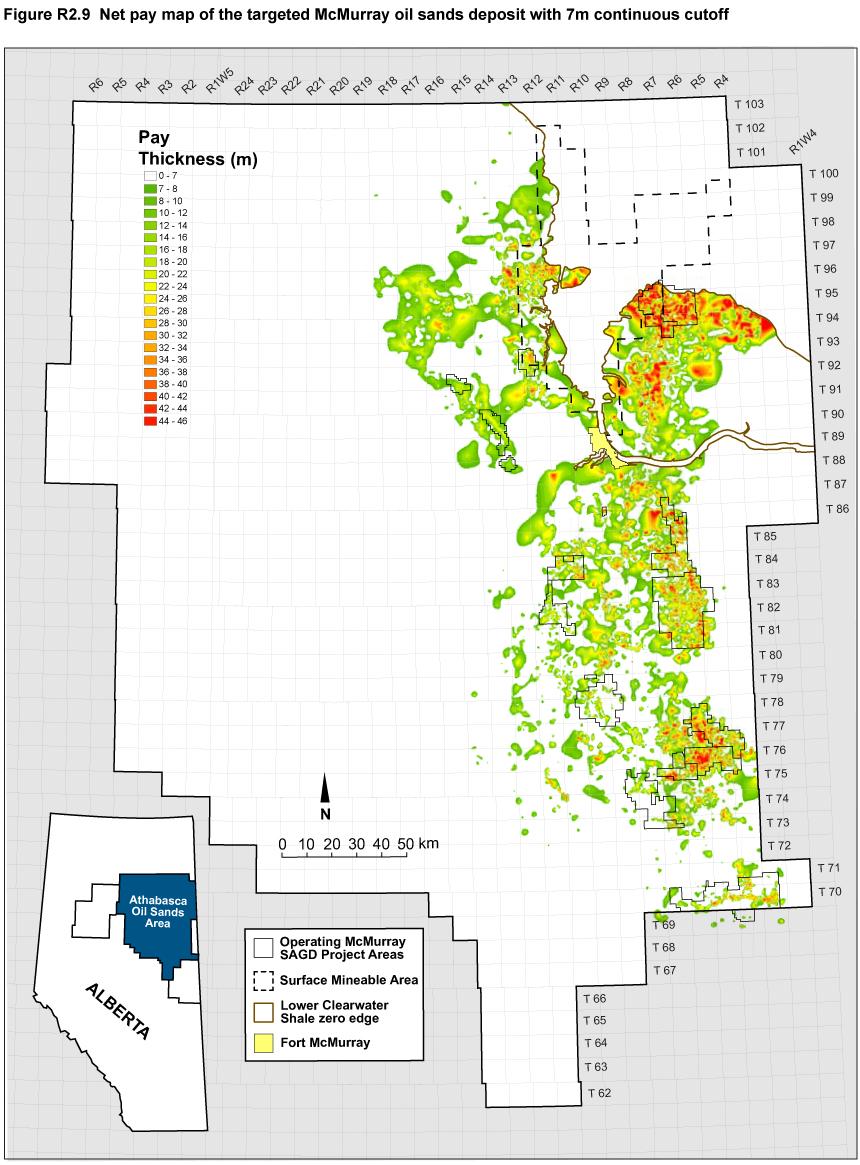
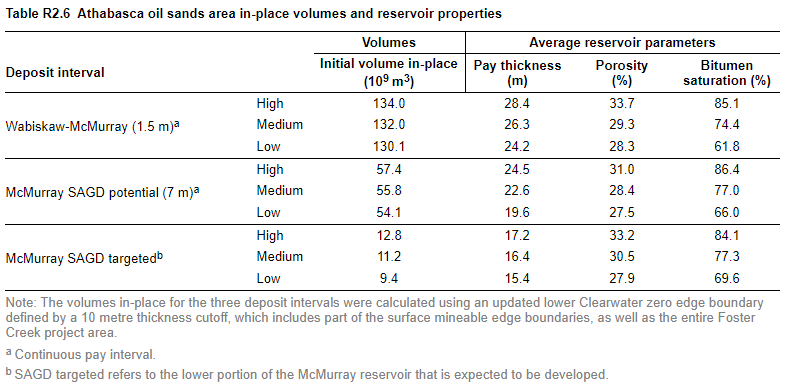
Table R2.6 shows the low, medium, and high values for OBIP and the average reservoir properties for the deposit intervals: Wabiskaw-McMurray, McMurray SAGD potential, and McMurray SAGD targeted.
Estimates of ultimate recovery factors used for the volumetric evaluation are based on information provided by operators in their applications or Directive 054 submissions.
Initial established reserves were calculated using a distribution of ultimate recovery factors, ranging from 38% to 74%, for all existing SAGD projects producing from the McMurray Formation in the Athabasca oil sands area. This distribution for the recovery factors was then multiplied by the distribution of OBIP to get low, medium, and high estimates of the initial established reserves.
This approach ensures that the range of uncertainty in the recovery between the different projects is captured, allowing for a consistent evaluation across the entire Athabasca oil sands area.
Table R2.7 shows the low, medium, and high estimates for recoverable bitumen reserves in the Athabasca oil sands area for the McMurray Formation with SAGD potential.

This estimate combines traditional reserves and resource values in accordance with AER criteria.
Volumes used for estimating the initial established reserves are as follows:
- Volumes from drainage areas with wells that are drilled and completed.
- Volumes from drainage areas with wells that are on production.
- Volumes from drainage areas with wells that are suspended.
- Volumes from areas the operator plans to drill within five years or are currently under development.
- Locations within the approved project area that meet well-delineation criteria.
A net pay cutoff of 7 m continuous was for inclusion in calculating initial established reserves. The well-delineation density must be at least 8 wells per section with 3-D seismic acquired or 16 wells per section without 3-D seismic.
The calculation of ultimate potential included the following additional sources:
- Locations inside the project areas that do not meet the well-delineation density described above but meet the 7 m net pay cutoff.
- Locations outside the project areas but within the Athabasca oil sands area that meet the 7 m net pay cutoff.


