Updated June 2024
Production Forecast
AER forecasts for production and well activity are available by Petroleum Services Association of Canada (PSAC) areas, crude oil density, and well type.
The AER does not separate low-permeability oil production from conventional crude oil production. It is often difficult or impossible to separate the tight portion of the reserve or tight oil production from a reservoir. Therefore, any tight oil volumes are included within the AER’s crude oil reserves and production reporting.
Crude oil production is forecast by density and by well type. In Alberta, crude oil is oil produced outside the oil sands areas or, if within the oil sands areas, from formations other than the Mannville and Woodbend Groups. Crude oil is classified by density into the following categories:
- ultra-heavy crude oil (density is greater than or equal to 925 kilograms per cubic metre [kg/m3])
- heavy crude oil (density is greater than or equal to 900 kg/m3 and less than 925 kg/m3)
- medium crude oil (density is greater than or equal to 850 kg/m3 and less than 900 kg/m3)
- light crude oil (density is less than 850 kg/m3)
Forecasting Crude Oil Production
In forecasting crude oil production, we combined expected production from pre-existing producing wells and new wells in each year (see Table S4.2).
In projecting production volumes, we used
- expected production from existing wells,
- the number of new wells placed on production,
- the average initial productivity of the new wells, and
- production decline rates of the new wells.
We used a model that also considers prices, royalties, taxes, capital costs, carbon price and other costs. The model calculates a net present value for representative wells (wells exhibiting average initial productivity rates, length, depth, decline rates, and other characteristics common to an area) for all years within the forecast period, which forms the basis of the forecast. The forecast considers limiting factors such as current and future capital market conditions and remaining reserves.
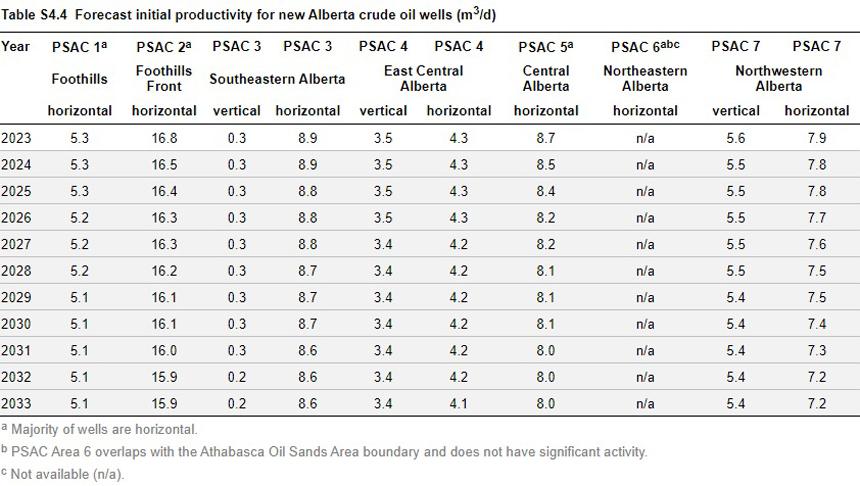
Initial Productivity Rates
Table S4.4 shows the forecast initial productivity using updated average rates for new wells by PSAC area.
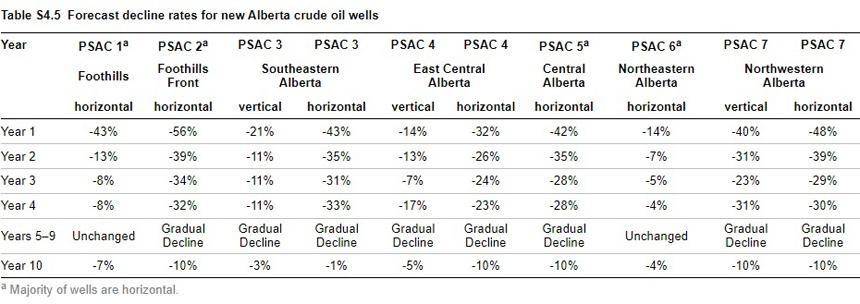
Decline Rates
Assumed decline rates in Table S4.5 will vary depending on such factors as the well's age, type, and geological location.
Demand Forecast
The Alberta crude oil demand forecast is based on historical refinery throughput, anticipated new refineries, and expansions to current refinery capacity.
Removals: Removals are the difference between Alberta production and Alberta demand.
Refinery throughput: The AER uses historical utilization rates when forecasting refinery throughput in Alberta.
Supply Cost
The following data were used to derive a supply cost estimate for the average horizontal or vertical/directional well in each PSAC area:
- the formation
- initial productivity
- production decline rates
- vertical depth
- total measured depth
- gas composition
- capital costs (drilling, casing, completion, and land acquisition)
- operating costs (processing and transportation)
- royalties
- taxes
- a 10% nominal rate of return
The supply costs are not risked (i.e., assumes a 100% success rate in drilling) and are estimated as wellhead costs, which are reported in Canadian dollars.
The AER defines a supply cost as the minimum constant dollar price needed to recover all capital costs, operating costs, royalties, taxes, and earn a specified return on investment. The supply cost calculation determines a dollar value required per unit of production.
The supply costs are based on representative wells in each PSAC area. Supply costs for different geological plays and PSAC areas vary significantly because of differing production rates, well types, drilling costs, operating costs, royalties, and other factors. Therefore, the results may not reflect wells that differ from the representative well profiles used in the analysis.
Data
All 2023 data are reported by industry until the end of December and do not include any subsequent amendments. The AER use crude oil production volumes submitted to Petrinex by producers.